This NEO is listed in the page of Asteroids with Comet-Like Orbits maintained by Y. Fernandez.
I
simulated 100 clones of this asteroid in the past 10^8 days trying to
confirm its possible cometary origin: the goal is to determine whether
some
clones might have arrived from the outskirt of the solar system -
arbitrary threshold: 100 AU.
The first step was to generate clones having orbital parameters distributed around the nominal ones with 1-sigma uncertainty as follows:
(2017 BR93)
| Classification: Amor [NEO] SPK-ID: 3767926 |
| [ Ephemeris | Orbit Diagram | Orbital Elements | Physical Parameters | Close-Approach Data ] |
[ show orbit diagram ]
| Orbital Elements at Epoch 2458000.5 (2017-Sep-04.0) TDB Reference: JPL 5 (heliocentric ecliptic J2000)
| Orbit Determination Parameters
Additional Information
|
The orbit condition code is 6 so there is still a lot of uncertainty.
Simulation approach
reference:
J.E.Chambers (1999)
A
Hybrid Symplectic Integrator that Permits Close Encounters between
Massive Bodies''. Monthly Notices of the Royal Astronomical Society, vol
304, pp793-799.
Integration parameters----------------------
Algorithm: Bulirsch-Stoer (conservative systems)
Integration start epoch: 2458000.5000000 days
Integration stop epoch: -100000000.0000000
Output interval: 100.000
Output precision: medium
Initial timestep: 0.050 days
Accuracy parameter: 1.0000E-12
Central mass: 1.0000E+00 solar masses
J_2: 0.0000E+00
J_4: 0.0000E+00
J_6: 0.0000E+00
Ejection distance: 1.0000E+02 AU
Radius of central body: 5.0000E-03 AU
Simulation Results
- 75 out of 100 clones have a cometary like orbit.
- of which: 16 came on a hyperbolic orbit. The one that had the highest speed had a Vinfinity about 15.2 km/s (Vinfinity = 42.1219*sqrt(-0.5/a) --> the semi-major axis being about -3.82 AU
The time (Year) when they entered the solar system was distributed as follows:
Min. 1st Qu. Median Mean 3rd Qu. Max.
-276249 -148774 -75459 -98680 -33904 -709
In a graphical form:

A look at the nominal asteroid
The
nominal asteroid itself does not have a cometary origin in the last 10^8 days. It appears to be nevertheless on a unstable orbit, there was a time in the past when its aphelion was at about 70 AU.
In the following plots (made with R package ggplot2), the vertical dashed lines show a close encounter with Jupiter.


A look at the clones - "footprint" diagrams
At any given time in the past, a clone had a certain perihelium q and a certain aphelium Q (I disregard the clones when on an hyperbolic trajectory because Q would be infinite).
Let's imagine that we plot all possible q-Q points in a diagram: the highest density area is the one where the clones happened to be for most of the time.
This is shown here ( I have used the R function stat_density2d):

In the diagram above, we can also see the current q-Q of the asteroid together with that of Jupiter and Saturn.
In a similar way, these are the footprints for w-om and e-i:


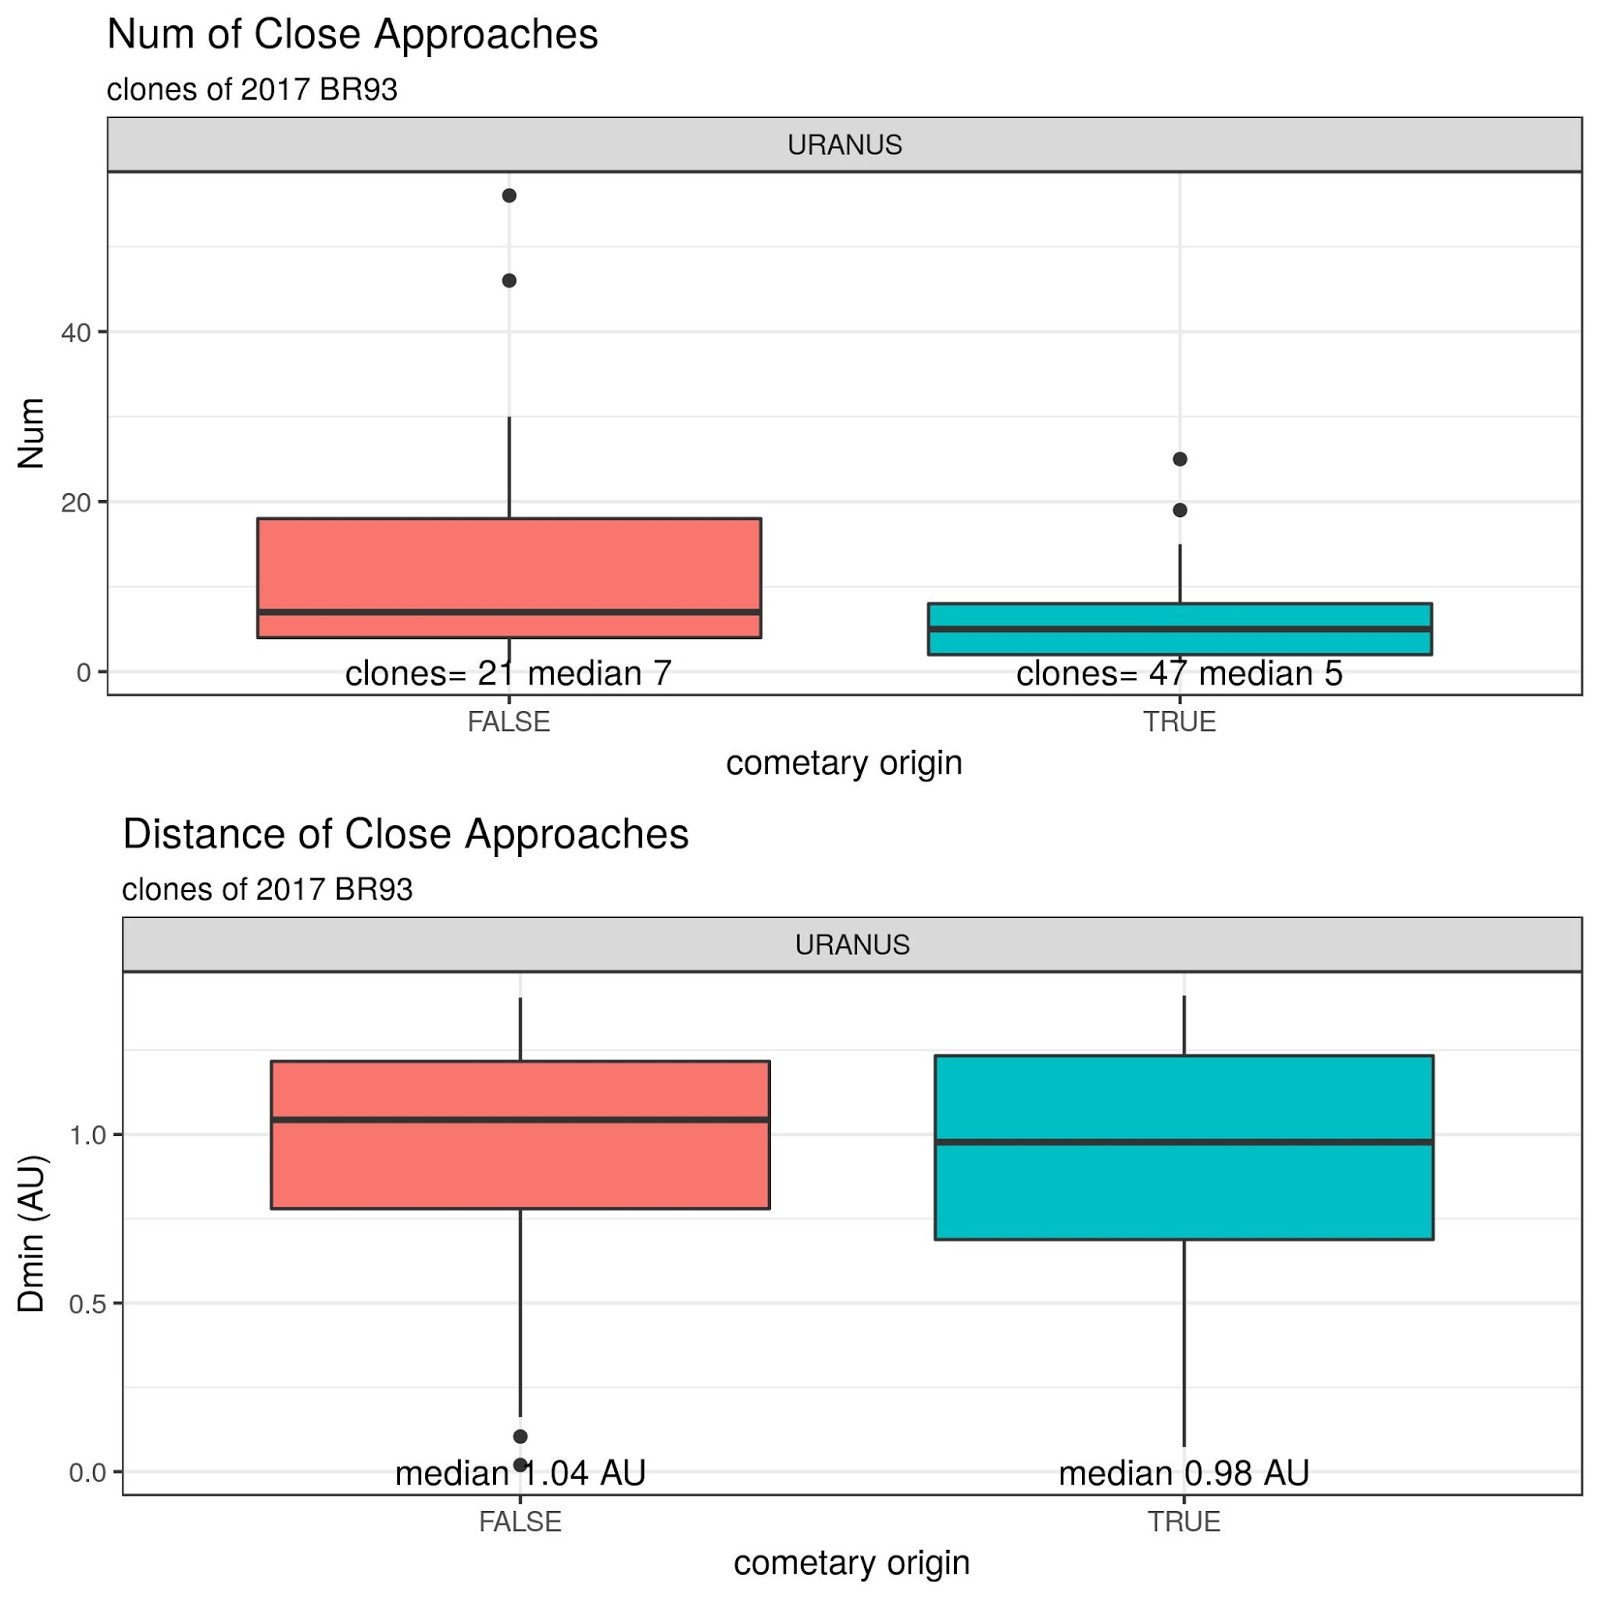
Analysis of close approaches
These plots show the distribution of close appproaches (number and Dmin distance) between the clones and the major planets.


Alessandro Odasso